| |
For system planning purposes, we have defined five planning zones representing distinct geographic areas within our service territory. Within each zone, the transmission system needs are compiled and assessed. This zone-level planning is one level at which transmission system needs are assessed and potential solutions developed. ATC’s five planning zones are shown in Figure ZS-21.
As part of FERC Order 890-A, FERC requires a coordinated, open, and transparent transmission planning process on both a local and regional level. To comply with these requirements, ATC submitted a compliance filing on Order 890-A that provides a summary of our network planning process to ensure that the economic planning process is both coordinated and open. The solutions ultimately selected to address the identified needs and limitations will reflect the input of transmission planning process stakeholders, including customers, state and local officials, the public, and coordination with other planning processes to the extent possible. Please refer to Methodology & assumptions for a better understanding of the basis for the results discussed by zone.
For each zone, we compiled recent information on:
- Demographics
- Future population and employment projections
- Environmental considerations
- Electricity demand and generation
- Transmission system issues
- 2012 study results including minimum load sensitivity
- 2016 study results including various system bias scenarios
- 2021 study results including various system bias scenarios
- 2026 study results
Demographics – Long-term overview
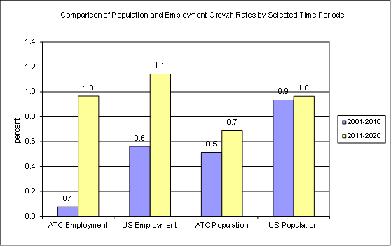
For the ten-year period 2001 to 2010, population and employment for the American Transmission Company (ATC) service area, which owns approximately 80 percent of the transmission lines in the state of Wisconsin, has experienced significantly slower growth in both employment and population when compared to growth in employment and population for the United States.
The population of the service area grew at an annual rate of 0.5%, while the United States increased 0.9% over that same period; however, employment growth in the ATC service area has been impacted due to the current economic slowdown. The annual employment growth rate has slowed to just 0.1%, while again the United States grew significantly faster at 0.6%.
Population in the ATC service area is projected to grow at 0.7% annually between 2011 and 2020, while the United States is projected to grow 1.0%. Employment in the ATC service area for the same period is projected to grow at 1.0% annually, while the growth in employment for the United States is projected to increase slightly faster (1.1%).
Within the ATC service area over the historical period, the highest annual growth rate for both population (0.9%) and employment (0.6%) occurred in the ATC Zone 3, which is defined as South Central/Southwest Wisconsin and North Central Illinois and includes the Wisconsin counties of:
- Columbia
- Crawford (southern portion)
- Dane
- Dodge
- Grant
- Green
- Iowa
- Lafayette
- Jefferson
- Richland
- Rock
- Sauk
- Walworth and
- Winnebago, Illinois (northern portion)
In addition, the Zone 3 historical annual growth rates for population and employment are similar to both the Rest-of-Wisconsin and the United States growth rates.
For the 2011-to-2020 period, Zone 3 again is projected to grow faster than any other ATC zone, and the projected growth rates for population and employment are slightly greater than the Rest-of-Wisconsin and the United States.
| |
Annual Growth Rates |
| Employment |
Population |
| 2001-2010 |
2011-2020 |
2001-2011 |
2011-2021 |
| Zone 1 |
0.1 |
0.9 |
0.2 |
0.6 |
| Zone 2 |
-0.4 |
0.8 |
-0.3 |
0.2 |
| Zone 3 |
0.6 |
1.2 |
0.9 |
1.2 |
| Zone 4 |
0.2 |
0.9 |
0.5 |
0.7 |
| Zone 5 |
-0.3 |
0.8 |
0.5 |
0.5 |
| ATC Total |
0.1 |
1.0 |
0.5 |
0.7 |
| |
| Rest of MI |
-1.2 |
0.8 |
0.0 |
0.3 |
| Rest of WI |
0.6 |
1.0 |
0.7 |
1.0 |
| |
| Michigan |
-1.2 |
0.8 |
0.0 |
0.3 |
| Wisconsin |
0.2 |
1.0 |
0.6 |
0.8 |
| |
| United States |
0.6 |
1.1 |
0.9 |
1.0 |
Historically, the growth in ATC service area population and employment has been slower than both the Rest of Wisconsin and the United States. The historical trend, however, is not being projected to continue for employment. The annual employment growth rate for the ATC service area is in line with the projected growth rates for both the Rest of Wisconsin and the United States. The slower historical population growth relative to the Rest of Wisconsin and the United States is projected to continue.
Demographics – Short-term overview
As verified by the National Bureau of Economic Research, the national economy was in recession from December 2007 to June 2009. “Wisconsin employment declined 4.5% in 2009 and 0.8% in 2010. Wisconsin started to modestly add jobs in January 2010, but the gains were not enough to lift total annual employment above 2009. Wisconsin employment will grow between 1% and 2% per year between 2011 and 2014.”
As illustrated in the graph below, employment peaked in 2007, declined slightly in 2008, fell dramatically in 2009, and again fell in 2010; however, year-to-date 2011 state employment is increasing slightly over 2010 employment levels.
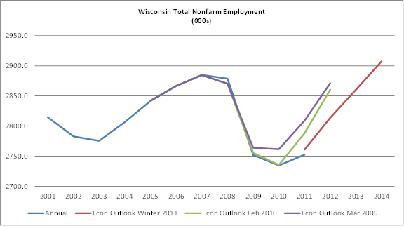
Sources:
Actual - Bureau of Labor Statistics, State and Metro Area Employment, Hours, & Earnings databases (2011 actual is the average of January through March 2011 data)
Econ Outlook Mar 2009 - Wisconsin Economic Outlook March 2009, Appendix 1
Econ Outlook Feb 2010 - Wisconsin Economic Outlook February 2010, Appendix 1
Econ Outlook Winter 2011 - Wisconsin Economic Outlook Winter 2011, Appendix 1
The current economic outlook projects that the decline in state employment will stop in 2011 and projects state employment to grow 1.3% in 2011 and 1.9% in 20121; however, given the larger-than-expected decline in the actual state employment from 2008 through 2010, “getting back” to the long-term trend will require several years of strong economic growth; as a result, the estimates of future growth in both employment and population, as illustrated by the tables below, should be viewed as “upper bound” estimates.
Population (in thousands)
|
| |
2001 |
2011 |
2015 |
2020 |
| Zone 1 |
509.9 |
522.1 |
534.9 |
551.6 |
| Zone 2 |
334.9 |
327.6 |
330.0 |
333.5 |
| Zone 3 |
1,093.8 |
1,204.8 |
1,262.5 |
1,336.6 |
| Zone 4 |
1,059.0 |
1,114.8 |
1,144.1 |
1,182.6 |
| Zone 5 |
1,853.3 |
1,943.9 |
1,982.6 |
2,034.1 |
| ATC Total |
4,850.8 |
5,113.3 |
5,254.2 |
5,438.4 |
| |
| Rest of MI |
9,707.6 |
9,735.1 |
9,858.6 |
10,028.4 |
| Rest of WI |
856.4 |
917.7 |
953.6 |
1,000.0 |
| |
| Michigan |
10,006.1 |
10,026.7 |
10,151.8 |
10,324.0 |
| Wisconsin |
5,408.8 |
5,739.3 |
5,914.6 |
6,142.8 |
| |
| United States |
285,081.6 |
313,009.6 |
325,343.4 |
341,251.7 |
| Employment (in thousands) |
| |
2001 |
2011 |
2015 |
2020 |
| Zone 1 |
301.4 |
311.1 |
322.7 |
337.6 |
| Zone 2 |
167.4 |
165.5 |
171.1 |
178.3 |
| Zone 3 |
730.2 |
793.0 |
832.5 |
884.4 |
| Zone 4 |
681.2 |
708.2 |
735.4 |
770.8 |
| Zone 5 |
1,151.7 |
1,149.5 |
1,188.5 |
1,239.1 |
| ATC Total |
3,031.9 |
3,127.3 |
3,250.3 |
3,410.2 |
| |
| Rest of MI |
5,339.2 |
4,915.4 |
5,083.6 |
5,299.0 |
| Rest of WI |
506.0 |
547.1 |
569.9 |
599.4 |
| |
| Michigan |
5,489.8 |
5,064.3 |
5,237.6 |
5,459.6 |
| Wisconsin |
3,387.3 |
3,525.5 |
3,666.2 |
3,849.0 |
| |
| United States |
165,510.2 |
178,646.4 |
186,999.8 |
197,896.7 |
About the study results
For each zone, Planning Criteria limits that are exceeded (overloads, low voltages, etc.) are identified from the results of each base model and associated sensitivity models along with their causes. The identified needs and exceeded limits are categorized by ATC planning zone. Tables ZS-1 through ZS-4 list the combined limitations and instances where Planning Criteria limits are exceeded that were identified in the 2012, 2016, 2021 and 2026 analyses. The same information is shown graphically for the summer peak studies in Figures ZS-1 through ZS-20.
Note: The results for each zone in some cases are similar to the results presented in the 2010 10-Year Assessment issued in September 2010. Where new results or changes have been found, the new information is identified as such. A summary of changes for the 2011 10-Year Assessment can be found in Table PR-23.
ATC continues to focus more attention on dealing with unexpected conditions. For instance, it is important to have appropriate reactive power reserves to manage system conditions that differ from the norm. While many capacitor bank installations are proposed in each zone to meet specific system needs, it should be noted that these additions also increase the flexibility to deal with extreme system conditions. See the reactive power analysis and multiple outage studies discussions for more information about the ability of the ATC system to manage unexpected conditions.
The multiple outage analysis section contains a status summary of the steady state multiple outage studies that have been conducted. The system stability section includes a summary of multiple outage stability analyses reviewed or recently completed, providing general insights into current stability margins of major generating stations on our system.
|
|