Planning methodology and assumptions
Overview
This section describes the methods and techniques that we used to develop assumptions, analyze our transmission network and share results for the 2013 10-Year Assessment. Economic, regional, environmental and asset management planning processes are covered on the ATC website.
As part of the network assessment, ATC conducted power flow analyses to identify problems or constraints on the transmission system and evaluated the merits of potential reinforcements to address the system limitations that were identified. ATC meets with our stakeholders to discuss assumptions and results.
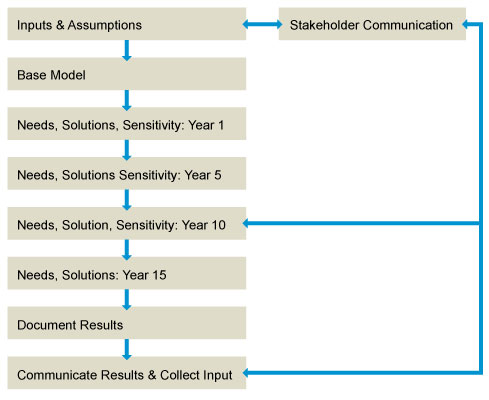
ATC’s network planning process is summarized in the below figure:
Open Planning Process
Since 2001, we have engaged in open and collaborative efforts to share information and solicit input on our plans. We believe that in making our planning efforts transparent and available to the public, the proposals for needed facilities can be more readily understood and accepted by communities that stand to benefit from them. In recent years the federal government has taken additional steps to ensure that transmission-owning utilities have produced and shared planning information with the public and local stakeholders. ATC is committed to continuing our open and transparent processes for planning our transmission system. We value the input of all of our stakeholders. We also strive to meet or exceed requirements in FERC Orders 890 and 1000. There has been increasing emphasis on how public policy requirements are addressed in ATC’s 10-Year Assessment process. ATC’s efforts in this area are described below.
The ATCLLC section in attachment FF of MISO’s tariff, describes seven planning functions at ATC. For each appropriate function, specific ATC actions are identified which will support incorporation of public policy requirements in ATC’s planning process. ATC’s 10-Year Assessment process is identified in the section describing ATC’s planning function called Network Adequacy Planning. This section identifies specific efforts ATC will engage in to assure public policy requirements are addressed in its 10-Year Assessment process. Below is a summary of how the 2013 assessment process has attempted to incorporate public policy requirements.
ATC’s 10-Year Assessment input process is very amenable to identifying stakeholder and customer concerns regarding Public Policy Requirements. Looking at the basic structure of our process identified in Figure 1, ATC has at least three phases in the process where we can discuss with Stakeholders how these requirements could be addressed.
- Assumptions Phase
- Needs Phase
- Solutions Phase
Documentation of the content and schedule for these 10-Year assessment discussions is included in notices on the Economic Benefits page of the ATC website, www.atc10yearplan.com. The intent of the discussion with stakeholders in each of the three phases is described in the following paragraphs.
In the assumptions phase of the process, ATC develops and proposes a study design for the coming assessment. We schedule a meeting with stakeholders to provide a summary of the study design that can facilitate discussion of planning criteria, study methods, assumptions for models, and potential needs. This input will affect decisions about which models to build and study, as well as resources and loads to model. This meeting is also an additional opportunity to collect responses to the results of the previous year’s assessment. In the 2013 process, we primarily relied on ATC economic benefits studies and MISO regional efforts to identify and incorporate public policy requirements. For the 10-Year assessment, to some extent some of these requirements are indirectly considered by ATC in the model data we gather from customers for loads and resources.
For the needs phase of the assessment, we schedule another meeting with stakeholders to summarize how the results of analysis may be impacting existing needs or creating new needs. Stakeholders are invited to participate and discuss needs that they think should have been identified and were not, or were identified and elicit questions. To identify needs that might be driven by public policy requirements ATC chose not to identify specific requirements individually, but instead, continued our practice of developing sensitivity studies for bias flows across our system: west-to-east and east-to-west, for example. We also chose not to create a model that included extremely high renewable resources in the west with an appropriate transmission overlay because such scenarios have been and are being considered at the MISO regional level. Instead, given our knowledge of existing requirements, we felt that our bias sensitivities would be a good proxy for potential flows from such public policy and renewable scenarios.
In the preliminary solutions phase, we hold a third meeting for stakeholders to participate and discuss whether appropriate solutions have been considered for identified needs. The projects making up the solutions we’ve identified in this assessment have multiple need drivers such as load growth, generation changes, asset renewal, public policy, and economic benefits. Reduced load growth has also been reflected in the delays and even cancellations of some projects. It is not always easy to tell how much each driver affects the need for a specific project in the screening studies that contribute to the assessment.
The Stakeholder process culminates in the publication of the assessment, both a printed summary and a posting on the 10-Year Assessment web site. ATC is involved in the assumptions and processes through which the MISO regional Public Policy studies are carried out and relies on that involvement to ensure the reliability of our system can be maintained.
The information in this report provides further foundation for continued public discussions on the transmission planning process; identified transmission needs and limitations; possible resolutions to those needs; and coordination with other public infrastructure planning processes.
Analysis Introduction
Included in this section is a discussion of the years ATC identified to model to satisfy both the near-term (1 – 5 year horizon) and long-term (5 year and beyond horizon) NERC standards for assessing the transmission system. Also included in this section is discussion on how ATC built each of the models used in this Assessment. Discussion items include topics such as load forecasting; which reinforcements and new generation to include in models; which system load levels, import levels and system bias scenarios to evaluate.
During the network assessment of our transmission system, we performed simulations on a variety of models as discussed below in this section. ATC not only uses these models to identify where constraints or system limitations may exist, but we also used these models in testing the robustness of potential system reinforcements. Per ATC’s Transmission System Planning Criteria, constraints or system limitations were identified for NERC Category A type system conditions.
For NERC Category B, C or D contingencies, system limitations or constraints are identified using slightly different criterion. For these types of system contingency conditions, system limitations are identified according to ATC Transmission System Planning Criteria.
The system performance analysis conducted in this Assessment included steady state power flow analyses, stability simulations, multiple outage impacts as well as economic evaluations, generator interconnection impacts, and transmission-distribution interconnection impacts.
Network assessment methodology
American Transmission Company’s 2013 10-Year Assessment provides current results of planning activities and analyses of the ATC transmission facilities. These activities and analyses identify needs for network transmission system enhancement and potential projects responsive to those needs.
Since 2001, we have engaged in open and collaborative efforts to share information and solicit input on our plans. We believe that in making our planning efforts transparent and available to the public, the proposals for needed facilities can be more readily understood and accepted by communities that stand to benefit from them. In recent years the federal government has taken additional steps to ensure that transmission-owning utilities have produced and shared planning information with the public and local stakeholders. The Attachment FF-ATCLLC in the MISO tariff’s Attachment FF describes ATC’s open planning processes.
The information in this report provides further foundation for continued public discussions on the transmission planning process; identified transmission needs and limitations; possible resolutions to those needs; and coordination with other public infrastructure planning processes.
Computer simulation model years for the 2013 network Assessment analyses were selected in order to meet NERC requirements for a 1-5 year horizon and beyond the 5 year horizon. The years 2014 and 2018 were selected to meet the 1-5 year horizon. The years 2023 and 2028 were selected to meet the beyond 5 year horizon. A range of system conditions and study years were developed and analyzed for the 2013 Assessment. Steady state peak load models for all four years were created. In order to address uncertainty in reactive power capability and preserve some margin for the ATC area, two additional models were created for each year. For one of the models the maximum and minimum reactive power capability was reduced by 10 percent for appropriate generators within the ATC footprint. These models were used for intact system condition (TPL-001-0) analysis. For the second models the maximum and minimum reactive power capability was reduced by 5 percent for appropriate generators within the ATC footprint. These models were used for any contingency analysis.
The needs identified were determined by identifying facilities whose normal or emergency limits are exceeded. The criteria we used to determine what these limits are provided in the ATC Transmission System Planning Criteria.
This assessment was developed in a chronological fashion. Planned transmission additions expected to be in service by June 2013 were included in the 2014 model, as listed in Table PF-1. Projects that have completed the analysis and are either under construction, have filed an application to construct, or are in the process of preparing an application were included in the 2018, 2023 and 2028 models as appropriate based on projected in service dates (See Tables PF-2, PF-3 and PF-4).
Load forecast
Steady state summer peak models were built using our customers load forecasts (50/50 projections) as a starting point, meaning that there is a 50 percent chance that the load level will either fall below or exceed the customer projection. In 2012, customer load forecasts were gathered for all ATC customers through the year 2022 (in most cases through the year 2028 and one through the year 2021). The forecasts were compared to previous historical and forecasted data to ensure validity and consistency. As a final step, the finalized forecast information was forwarded back to our individual customers to ensure their concurrence. Once consensus was achieved, the data was incorporated into our models.
Certain ATC customers did not provide an 11th-year load forecast for the year 2023. To obtain a forecast for 2023, certain customer-provided forecasts were extended by growing their load by using a 3-year linear growth rate calculated over the last three years of the forecasts provided by the customer. Load power factors were held at their levels at the last year forecast. Non-scalable loads were also held at their load levels at the last year forecast using this methodology.
The 2028 summer peak load model was developed utilizing similar methodology. To obtain a projection for 2028, customer-provided forecasts were extended by growing their load by using a 3-year linear growth rate calculated over the last three years of the forecasts provided by the customer. Load power factors were held at their levels at the last year forecast. Non-scalable loads were once again held at their load levels at the last year forecast. It should be noted that the loads utilized in the 2028 summer peak model do not reflect an actual load forecast, but merely a projection (or “load model”) based upon the best available information. The purpose for the 2028 projection is not to develop projects to address all issues, but to develop a sense for the need(s) for long lead-time projects.
ATC Peak Load Projections (MW) including line losses
| Year | MW load | Study period compounded growth rate |
|---|---|---|
| 2013 | 12,923 | Not applicable |
| 2014 | 13,047 | Not applicable |
| 2018 | 13,554 | 0.96% (2013-2018) |
| 2023 | 14,142 | 0.85% (2018-2023) |
| 2028 | 14,755 | 0.85% (2023-2028) |
| Overall | 0.89% (2013-2028) |
It should be noted that we worked with the distribution companies as much as possible to confirm forecast variations from past trends.
Model building
Assumptions common to all models
The following assumptions are common to all models studied in the 10-Year Assessment. Any exceptions are listed within the respective assumption section.
- New Generation
- Generation Retirements
- Cutoff Dates
- Generation Project Schedule
- Generation Outside of the System
- Generation Dispatch
- Line and Equipment ratings
- Project Criteria
New generation
There have been generation projects proposed within the ATC service territory. Many of these proposed projects have interconnection studies completed and a few have had transmission service facility studies completed. Some have proceeded to or through the licensing phase and one or more are under construction. However, there are also proposed generation projects that have dropped out of the generation queue (refer to Generation Interconnections), adding uncertainty to the transmission planning process. To address this planning uncertainty, we have adopted a criterion for purposes of this and prior Assessments, to establish which proposed generation projects would be included in the 2013 Assessment models.
In the 2013 10-Year Assessment, the criterion was broken into two time frames, years 1 through 5 and 6+ years.
- For years 1 through 5, only those generators with FERC approved interconnection agreements will be included in the planning models.
- Beginning with year 6 and continuing into the future, generators are only required to have a Facility Study completed in order to be included in the 10-Year Assessment models.
One wind generator in the ATC footprint has a suspended FERC approved interconnection agreement. For the first three years following the requested in-service dates, ATC criterion calls for modeling these facilities but dispatching them at the bottom of the dispatch order. After the three years, the generators will be dispatched in their normal dispatch order. The wind generators with suspended agreements were included in the models built for the 10-Year Assessment analysis. The 2014 model showed this generator as out of service. The 2018, 2023, and 2028 models have these generators in-service and dispatched.
Generation retirements
On occasion, generators connected to the ATC transmission system are retired or mothballed. As a result, we developed criteria to determine when generators should no longer be included in our 10-Year Assessment models. If the generator has a completed MISO Attachment Y study, the generator will be disconnected in the appropriate load flow study models. In addition, ATC sent an annual letter to each generation owner. Generating companies were asked to identify generator retirements or mothballing that should be included in ATC’s planning horizon. Generators identified as such by the customer will be modeled off line in the relevant models.
There are generators that have been publicly announced as likely candidates for retirement. However, using the disconnection criteria above, in the 2013 10-Year Assessment models we assumed the following generators were to be out of service (ATC cannot comment on whether these units have completed MISO Attachment Y studies).
Generation retirements
| Plant Name | Zone | Installed capacity | Assumed out of service |
|---|---|---|---|
| None | 0 | ||
| Net decrease before 2013 | 0 MW | ||
| Net decrease after 2013 | 0 MW |
Please note that recently some of our customer generators reduced their maximum MW outputs, but those reductions occurred after the cutoff points defined below. In addition, ATC became aware of the confirmed retirement of the Kewaunee Power plant after the cutoff date for the 2013 10-Year Assessment. The only study in this assessment with Kewaunee retired was the retirement sensitivity study.
Cutoff dates
For model building purposes, we assumed cutoff dates for generation changes to be included in models. In order to include the latest data in the models, cutoff dates correspond to the dates the models were built.
- 2014 models – December 6, 2012
- 2018 models – December 6, 2012
- 2023 models – December 6, 2012
- 2028 models – December 6, 2012
It was assumed that if the generator was available as of the cutoff date, it was available for dispatch in that grouping of models.
Generation projects schedule
To maintain the schedule needed to complete this Assessment, the models were developed during late 2012 and early 2013. Only those generation projects that qualified to be included in our planning models, as of the various cutoff dates, were included in the Assessment models. For generation projects not in service by June 2013, the criterion above resulted in the following proposed generation projects being included in the applicable power flow models.
Proposed generation projects in applicable models
| Plant Name | Zone | Installed capacity increase | Dispatched increase | Assumed in-service |
|---|---|---|---|---|
| Garden wind farm | 2 | 13.4 MW | 13.4 MW | Dec 2013 |
| Glacier Hills wind farm | 3 | 17.4 MW | 17.4 MW | Dec 2014 |
| Stoney Brook wind farm | 4 | 19.7 MW | 19.7 MW | May 2014 |
| Rothschild Biomass | 1 | 50 MW | 50 MW | Sept 2013 |
| Net increase by Dec 2013 | 63.4 MW | |||
| Net increase 2014-2028 | 37.1 MW |
A more comprehensive discussion of proposed generation is provided in Generation Interconnections.
Generation outside system
The model for the system external to ATC was taken from the most appropriate model included in the MMWG 2012 Series models. The external system interchange was adjusted from the 2012 MMWG Series models to match the latest ATC members’ firm interchange with the exception of the East to West Bias and the West to East Bias models which were built to represent a 1700 and 700 MW imports into ATC, respectively.
Generation dispatch
Balancing Authority area generation was dispatched based on economic dispatch for that Balancing Authority with the exception of the West to East Bias and Light Load models.
Line and equipment ratings
We revised line and equipment ratings based on updates to our Substation Equipment and Line Database (SELD).
Project criteria
The steady state models built for the 2013 10-Year Assessment include revised system topology based on projects that were placed in service in the model year, or were anticipated to be placed in service by June 15 of that year. Refer to Tables PF-1 through PF-4 for projects that were included in the analyses.
Steady state power flow models
Normal (Category A) Conditions
The load flow models for the 10-Year Assessment are built to include established (pre-contingency) operating procedures to assess system performance under the normal (Category A) conditions as required in the TPL-001-0 Reliability Standard. The relevant operating procedures are generally standing operating procedures that apply for the planning horizon. These procedures include, but are not limited to, normal open points and switched capacitor banks. Normal open points are assumed to remain normally open in the base cases. Changes in the status of normally open points are provided by the system planners that participate in the decision to change the status of a normally open point. Switched non-mobile capacitor banks are assumed to be available for use by the system operators, except in the case of planned outages. This availability is represented by modeling these capacitor banks in the discrete adjustment voltage regulating mode. Mobile capacitor banks are modeled in the base case when there is a known date and location in the planning horizon during which the mobile capacitor bank is planned to be in service.
Planned Maintenance and Construction Outages
The load flow models for the 10-Year Assessment are built to include maintenance and construction outages that are planned to occur in planning horizon. These outages are typically conditions that are expected to last for a period of six months or more. The modeled outages are provided by the system planners that participate in the decision to schedule the maintenance or construction outage.
Protection Systems
All existing and planned protection systems, including any backup or redundant systems that would be applicable to a given contingency were simulated in the studies and analyses. In the steady state simulations, we simulated event based contingencies that reflect all of the elements that would be removed by the existing or planned protection system. Dynamic studies, in particular, simulate protection system operating times, associated breaker clearing times, and back up device tripping functionality.
Control Devices
All existing and planned control devices that would be applicable to a given contingency were simulated in the studies and analyses. These control devices include transformer automatic tap changers, capacitor bank automatic controls, SVC and the back-to-back HVDC (VSC) power flow controller.
Project deficient seasonal models
The load flow models built for the 10-Year Assessment are for system analyses in the Assessment. Some projects were purposely left out of these models in order to verify system problems and determine which problems worsen over time. We have taken the approach of evaluating subsequent summer peak seasons in each of our annual Assessments to determine the immediacy of needs identified, hence providing a means of prioritization.
The 2014, 2018, 2023 and 2028 steady state project deficient summer peak models were developed to evaluate needs, verify Assessment findings of the previous years, and confirm that previously identified needs will increase over time. The 2023 and 2028 project deficient models reflect years sufficiently forward in time to determine the need for and assess the performance of larger-scale projects (345 kV lines, for example) that could be expected to be in service in that timeframe.
All project seasonal models
After the initial analyses portion of the 10-Year Assessment was completed, “All Project” models were built. The “All Project” models were built with all planned and proposed projects included as well as the majority of the provisional projects. These models are more indicative of the expected system configurations for the three study years. The “All Project” models are more appropriate for internal studies performed by ATC planners throughout the year and for regional models. As part of the 10-Year Assessment, the zone planners perform contingency analyses on each of the “All Project” models. These analyses will verify whether all of the planned, proposed and provisional projects will resolve issues revealed in the 10-Year Assessment process and will not introduce any new limitations.
Load, dispatch and interchange profiles
Summer Peak (2014, 2018, 2023 and 2028)
- We utilized interconnection point load forecasts provided by various distribution companies in 2012 for both real and reactive power components of load. Please refer to the Load Forecast section, for further details.
- Only firm interchange was included in the analyses.
- Mackinac VSC set to the VSC bypass flow as long as it is within +/- 70 MW for the 2014+ model years.
Summer Peak 95% QMax/Qmin (2014, 2018, 2023 and 2028)
- We utilized interconnection point load forecasts provided by various distribution companies in 2012 for both real and reactive power components of load. Please refer to the Load Forecast section, for further details.
- Only firm interchange was included in our analyses.
- Mackinac VSC set to the VSC bypass flow as long as it is within +/- 70 MW for the 2014+ model years.
- Special additions: Generator QMax/Qmin reduced to 95%.
Summer Peak 90% QMax/Qmin (2014, 2018, 2023 and 2028)
- We utilized interconnection point load forecasts provided by various distribution companies in 2012 for both real and reactive power components of load. Please refer to the Load Forecast section, for further details.
- Only firm interchange was included in our analyses.
- Mackinac VSC set to the VSC bypass flow as long as it is within +/- 70 MW for the 2014+ model years.
- Special additions: Generator QMax/Qmin reduced to 90%.
Shoulder 70% Models (2018 and 2023)
- We utilized interconnection point load forecasts provided by various distribution companies in 2012. Please refer to the Load Forecast section, for further details.
- The 2018 and 2023 shoulder models were created by selectively scaling down loads that generally vary by time-of-day to approximately 65 percent of the summer peak condition to produce an overall 70 percent of summer peak load condition. A 70 percent load level was chosen to represent the shoulder model because under this scenario, flows are changing as a result of the Ludington pumping cycle. However, it was recognized that loads at individual points will vary under real-time shoulder conditions.
- The external system interchange was adjusted from the 2012 MMWG Series 2018 and 2023 summer interchange, respectively, to match latest ATC members’ firm interchange.
- Mackinac VSC set to the VSC bypass flow as long as it is within +/- 70 MW.
Shoulder 90% Models (2018 and 2023)
- We utilized interconnection point load forecasts provided by various distribution companies in 2012. The 2018 shoulder 90% model was created by decreasing load 10 percent below expected summer peak conditions. Please refer to the Load Forecast section, for further details.
- To simulate a steady state reverse east-west bias power flow, models were developed with 90% load levels, 1,700 MW import into ATC, and a 2,000 MW transaction from east to west.
- ATC system biased in an east to west direction.
- Mackinac VSC set to the VSC bypass flow as long as it is within +/- 70 MW.
Minimum Load Scenario (2014 and 2018)
- ATC Load: 5,195 MW and 5,368 MW, respectively.
- 2012 forecast collection, scalable loads reduced to 33% of peak + non-conforming off-peak loads = 40% of Peak load.
- Total ATC Generation: 4,964 MW and 5,128 MW, respectively.
- Includes all planned and proposed projects to be in-service by 6/15/2014 and
- 6/15/2018, respectively.
- Interchange: Firm interchange only as of 12/6/2012.
- Dispatch: ATC-wide Merit order as of 12/6/2012.
- Mackinac VSC set to the VSC bypass flow as long as it is within +/- 70 MW for the 2014+ model years.
West to East Bias Scenario (2018 and 2023)
- ATC Load: 9,460 MW and 9,871 MW, respectively.
- 2012 forecast collection, scalable loads reduced to 65% + non-scalable loads = 70% of Peak load as drawn from Operations historical data.
- Total ATC Generation: 9,070 MW and 9,484 MW respectively.
- Includes all planned and proposed projects to be in-service by 6/15/2018 and
- 6/15/2023 respectively.
- Interchange: ATC net as provided in Operations data -700 MW.
- Dispatch: ATC-wide Merit order as of 12/6/2012.
- Mackinac VSC set to the VSC bypass flow as long as it is within +/- 70 MW.
- Special additions:
- Wind generation in the ATC footprint dispatched to 45% of Pmax as drawn from Operations historical data.
- Wind generation west of ATC dispatched to 50% as drawn from Operations historical data.
- Wind Generation south of ATC dispatched to 55% as drawn from Operations historical data.
- Minnesota-Wisconsin Export interface (MWEX) loaded to 1,400 MW.
- Manitoba Hydro Exports set to 1,350 MW.
- All generation increases were modeled to generation reductions south and east of ATC.
Model years
We started model development for this Assessment by building a system model that represented 2013 summer peak conditions. This 2013 model is referred to as an “as-planned” model because essentially everything in the model is certain to be in service by 2013 summer. This model then was modified to create each of the subsequent Assessment study models including the changes previously described for each model.
Computer simulation model years for the 2013 network Assessment analyses were selected in order to meet NERC requirements for a 1-5 year horizon and beyond the 5 year horizon. The years 2014 and 2018 were selected to meet the 1-5 year horizon. The years 2023 and 2028 meet the beyond 5 year horizon. The years 2014, 2018 and 2023 were chosen to coordinate with the most recently released MMWG models that were available.
The 2014, 2018, 2023 and 2028 models were developed to evaluate needs, verify findings of the 2012 Assessment, and confirm that previously identified needs will increase over time. The 2023 and 2028 models reflect years sufficiently forward in time to determine the need for and assess the performance of larger-scale projects (345 kV lines, for example) that could be expected to be in service in that timeframe.
Dynamic stability assessment models
The process for performing dynamic stability assessments includes three types of analyses: (1) the annual review of existing generator angular stability, (2) specific generator interconnection study reports, and (3) specific voltage stability assessments.
The base case for the annual review of existing generation angular stability for this compliance monitor period is a 2016 light load model based off a 2010 series MMWG 2016 model, modified to include the ATC all-projects topology in the local area.
The base cases for specific generator interconnect study reports are described in detail in the associated study report.
The base cases for specific voltage stability assessments are described in detail within the associated study report. The voltage stability study for this compliance monitor period is the Rhinelander Area Voltage Stability Study.
Short-circuit assessment models
The base case model for the annual short-circuit assessment was the CAPE application equivalent to the transmission planning 2013 ‘as built’ model with maximum generation dispatch. For our studies of new generation interconnections, the base model is modified to include the new facilities and any proposed transmission system modifications.
Preliminary needs and solution development
Steady state project-deficient needs assessment
System intact and single contingency simulations
ATC performed system intact and single contingency simulations on the 2014, 2018, 2023 and 2028 models. Single contingency simulations included single element (line, transformer, generator, bus and switched shunt) and event-based breaker-to-breaker outages. We ran these simulations for all of the steady state models described above.
Comparison of results vs Planning Criteria
The models described above are analyzed and compared to the ATC Transmission System Planning Criteria. Limits that approach or exceed our criteria are then listed in a limitations table.
Reconcilliation of significant changes to power flow results
To reconcile changes in power flow results between Assessments, zone planners ran data comparisons to determine if limitations identified in prior Assessments have become more severe, less severe, or have been mitigated. Steps were taken to verify topology and other model changes to ensure that the results are consistent with all of the available information.
Preliminary Solution Development
New Limitation
If a new limitation is found in the initial screening, the zone planner will take steps to ensure that the limitation is valid, including verification of the power flow model. If the new limitation is within the current five-year timeframe, the zone planner will then check for potential delayability, including investigation of operating guides or other mitigation measures.
Cost estimates are developed for one or more solution options that effectively address the identified limitations. After cost information has been obtained, the zone planner initiates the project development process by completing the project request to create a provisional project. Finally, the project request is processed through ATC’s project approval process.
Repeat Limitation
If a previously identified limitation is found in our initial screening, the zone planner will re-verify that existing solution options address that limitation. If an in-service date or scope change is warranted, updated cost estimates are developed. The project request is then updated with the revised in-service date, cost, scope and/or justification. The updated project request is then resubmitted through ATC’s project approval process.
Network Unspecified Project Process
Unspecified projects are defined as those projects which may shift into the 10-year timeframe. Unspecified projects can be the result of the following reasons.
- Changing load forecast.
- Changes in generation and distribution interconnection projects.
- Changes in public policy requirements.
- Additional projects that are driven by economic benefits or multiple outage impacts.
A significant amount of dollars were set aside in ATC’s capital forecast in order to address Network Unspecified Projects. ATC begins to identify Network Unspecified Projects with internal discussions to determine how to best serve our customers local and regional needs. In these discussions, we collaboratively determine which potential projects are more likely to be built within the 10-year Assessment period. The cost and potential benefits of the project are discussed, vetted and approved by our executives. After consensus is reached, the ATC capital forecast is updated to include these Network Unspecified Project dollars.
All Projects Assessment
After the 10-Year Assessment analysis is completed, models are built that include all planned, proposed and some provisional projects. These models are called “All Projects” models and are more indicative of the expected system configurations for 2014, 2018, 2023 and 2028 study years. These models may be appropriate for internal planning studies performed throughout the year.
As part of the 10-Year Assessment, zone planners perform a contingency analysis on each of the “All Projects” models. The contingency analysis includes systematically removing each line, generator, transformer, switched shunt and modeled bus ties individually to determine the effect on the transmission system. The analysis will verify whether all of the planned, proposed, and provisional projects will resolve issues revealed in the Assessment process.
This All Projects Assessment provides a list of reinforcements that are beginning to optimize our reinforcement plan. The following are three important questions regarding this plan.
- How do the reinforcements for all the zones perform together?
- Does applying a solution in one zone create a problem that was not seen before in another zone?
- Are some zone solutions redundant when all the solutions are applied to the system?
We attempt to address the first two questions, in our 10-Year Assessment. Models for years 2014, 2018, 2023 and 2028 were built that included reinforcements reflecting our best thoughts on all of the most likely planned, proposed and provisional projects to address the identified issues. These projects are those identified in the project tables for this Assessment with specific in-service dates. First contingency analysis was performed on these new models, including selected outages on neighboring systems. This analysis showed that the reinforcements in total did indeed deal with the issues identified and did not create any new issues to be resolved.
Special Review and Analyses
Multiple Outage Review and Analysis
ATC performs a comprehensive evaluation of each applicable NERC Category C and Category D type outage on either an annual schedule, a rolling periodic schedule, or interconnection study specific schedule.
Category C Outages
ATC performs a comprehensive screening of each applicable NERC Category C type outage on at least a five year rolling schedule.
ATC performs an assessment of all of the Category C1 through C9 events, except the Category C4 events. Category C4 contingency events do not apply to ATC because there are no applicable HVDC facilities in the ATC system.
Category D Outages
ATC performs a sufficient assessment for each category of Category D extreme events analyses.
System Stability Review and Analysis
ATC generally investigates three type of system stability: steady state voltage stability, dynamic voltage stability and dynamic angular (e.g. generator) stability.
The specific system performance criteria that are used to assess each type of system stability are given in the ATC Transmission System Planning Criteria.
Steady State Voltage Stability
The steady state voltage stability analysis is performed on a specific area of the ATC system when general steady state analysis indicates areas of very low voltage or voltage collapse (non-convergent simulations) for NERC TPL-002 or TPL-003 reliability standard requirement contingencies in the near or longer term planning horizons. Additionally, each angular stability study performed by ATC screens the system for voltage stability issues through the application of the ATC voltage recovery criteria described in the ATC Transmission System Planning Criteria. If steady state or dynamic analyses identifies areas of weakness indicative of voltage instability, further examination of system characteristics and, possibly, more detailed analysis will be performed. This more detailed analysis may include replacement of lumped load modeling with more specific dynamic modeling of the distribution system and its loads.
Dynamic Voltage Stability
The dynamic voltage stability analysis is performed on a specific area of the ATC system when general steady state analysis indicates areas of very low voltage or voltage collapse (non-convergent simulations) for NERC TPL-002 or TPL-003 reliability standard requirement contingencies in the near or longer term planning horizons. Dynamic voltage stability analysis can reveal results where the voltage at some buses will collapse and not recover to acceptable values found be steady state analysis, which assumes that system “rides through” the dynamic recovery period.
Dynamic voltage stability analysis is assessed for any new or revised generation interconnection facilities before they are placed in service.
When dynamic analysis is performed and there is not a large stability margin, then normal load modeling is replaced with more specific, and generally conservative, dynamic load modeling. Very large loads may be modeled with specific dynamic models and the remaining loads are modeled with using lumped dynamic load models that depend on the percentage of industrial, commercial, agricultural and residential load at each distribution load interconnection point.
Dynamic Angular (Generator Stability)
The dynamic angular stability of all major generation facilities in the ATC system is assessed on a five year rotation. Generation facilities may be assessed in less than five years, if there are significant changes to the generator exciter, the generator governor, a power system stabilizer, the generator step up transformer, or nearby system topology. In addition, dynamic angular stability is assessed for any new generation facility before it is placed in service.
Generation facilities with a total net output above 100 MW and associated transmission lines operating usually above 100 kV are normally selected for system angular stability assessment. The methodology used in assessing the major generator stations includes:
- A review to determine that no significant system topological changes have occurred near the generator stations other than local load growth.
- A review of the parameter values and the model types used in representing the dynamic response of units at the generator stations in system angular stability simulations to determine that no significant changes have occurred.
- A review of the date of the last stability study conducted for each of the major generator stations to determine that the elapsed time does not exceed 5 years.
The assessments take into account applicable simulation requirements and performance requirements in the NERC TPL-002, TPL-003 and TPL-004 reliability standards, as well as the ATC dynamic performance criteria, which cover compliance with the TPL-503-MRO-1 reliability standard requirements.
ATC observes a ½ cycle margin required for tested generator data and a 1 cycle margin required for planned generator data. These margins are observed between the Maximum Expected Clearing Time (MECT) and Critical Clearing Times (CCT) that lead to unacceptable system instability.
Small Signal Stability
Since no previous studies have found any small signal instability situations in the ATC system and the MRO recently retired its small signal stability standard, no small signal stability assessment was performed this year. However, the ATC transient stability damping criteria will continue to be used as screening tool to determine whether any new small signal stability studies should be performed.
Documentation
Writing/approval processes
The 10-Year Assessment is written and developed by several contributors. The following steps are performed in order to ensure cohesive, consistent information.
- Requests are made for the latest financial, environmental, demographics, asset renewal and economics information from other ATC departments.
- Drafts of text, figures and tables are compiled for peer review.
- A summary presentation of all Assessment information is reviewed and approved by ATC management.
Once the information has been approved by all parties, the hard copy Summary Report is printed and distributed. The Summary Report and additional details are posted at www.atc10yearplan.com.