Planning Methodology and Assumptions
Overview
These sections describe the process we used to perform a network assessment of the ATC transmission system. The description includes study assumptions, methods we used to analyze our transmission network for planning criteria limitations, and how we shared results for the 2019 10-Year Assessment. Economic, regional, interconnections and asset management planning processes are covered at other locations on the ATC 10-Year Assessment website.
As part of the network assessment, ATC conducted power flow analyses to identify problems or constraints on the transmission system. The power flow models were updated with the latest assumptions. The analyses evaluated the merits of potential reinforcements to address the system limitations that were identified. ATC met with stakeholders to discuss assumptions and results. ATC’s network assessment process is summarized in Figure 1.
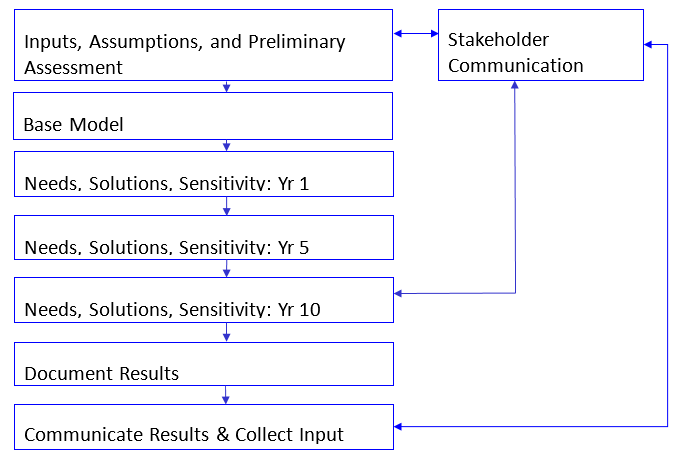
Figure 1: 10-Year Assessment Process
Stakeholder engagement process
ATC has developed a stakeholder engagement process that we use to obtain stakeholder input for developing our study assumptions, needs and solutions. More discussion of the process can be found on the stakeholder engagement process page of the website. Through this process we also ensure coordination of ATC’s potential projects with the Midwest Transmission Expansion Plan (MTEP) process.
Analyses introduction
Included in the following sections is a discussion of assumptions and study methods used for the years ATC simulated to satisfy the near-term (1 – 5 year) and long-term (5 year and beyond) transmission planning horizon requirements as required by NERC transmission system assessment standards. Also included is discussion of how ATC built each of the models used in this Assessment. Discussion items include topics such as load forecasting; reinforcements and new generation to include in models; and system load levels, import levels and system bias scenarios to evaluate.
During the network assessment of our transmission system, we performed simulations on a variety of models. ATC not only uses these models to identify where constraints or system limitations may exist, but we also used these models to test the robustness of potential system reinforcements. Where system limitations exist, they were identified for NERC Categories P0 through P7 conditions using the ATC Transmission System Planning Criteria.
The system performance analyses represented in this Assessment includes steady state power flow analyses and stability simulations. Multiple outage impacts, economic planning evaluations, generator interconnection impacts, distribution interconnection impacts, asset renewal plans, and short circuit study results were also gathered to complete the assessment.
Network assessment methodology
American Transmission Company’s 2019 10-Year Assessment provides results from planning activities and analyses of the ATC transmission facilities’ performance. These activities and analyses identify needs to improve the transmission system performance and potential projects able to address those needs.
Since 2001, we have engaged in open and collaborative efforts to share information and solicit input on our plans. We strive to make our planning efforts transparent and available to the public, believing the transparency about proposals for needed facilities will enable more understanding and acceptance by communities that stand to benefit from them. In recent years, the federal government has taken additional steps to ensure that transmission-owning utilities have produced and shared planning information with the public and local stakeholders. The Attachment FF-ATCLLC in the MISO tariff’s Attachment FF describes ATC’s open planning processes.
The information in this report provides further foundation for continued public discussions of the transmission planning process; identifies transmission needs and limitations; identifies possible resolutions to those needs; and discusses coordination with other public infrastructure planning processes.
Computer simulation model years for the 2019 network Assessment analyses were selected in order to meet NERC requirements. Specifically, for the steady-state assessment, the years 2020 and 2024 were selected to meet the near-term transmission planning horizon (1-5 year). The year 2029 was selected to meet the long-term transmission planning horizon (beyond 5 year). This led to a range of system conditions and study years developed and analyzed for the 2019 Assessment.
Once ATC received load forecasts from our customers, we performed a preliminary steady-state assessment to assure accuracy of the load forecast and to help determine project submittals to the next MISO MTEP cycle. This preliminary assessment included applying no-load-loss-allowed contingencies to 5- and 10- year-out summer peak models from the previous year’s assessment. No-load-loss-allowed contingency categories are those where the NERC TPL-001-4 standard does not allow interruption of firm transmission service or loss of non-consequential load as a solution to Bulk Electric System (BES) limitations. ATC also applies similar contingency categories to its non-BES facilities.
Final assessment steady-state peak-load models were then created for all three study years. Steady-state shoulder load models were created for years 2024 and 2029. Steady-state minimum load models were created for years 2020 and 2024. In order to address uncertainty in reactive power capability and preserve some margin for the ATC area, an additional model was created for each model above. For each of the additional models, the maximum lagging and leading reactive power capabilities were reduced by 10 percent for appropriate generators within the ATC footprint. These reduced reactive capability models were used for both intact system and contingency analyses.
Planning criteria-driven needs were determined by identifying facilities whose normal or emergency limits are exceeded. The criteria we used to determine these limits are provided in the ATC Transmission System Planning Criteria in effect at the time of these studies.
This Assessment was developed in a chronological fashion. It started by including only planned transmission changes expected to be in service by June 2020 in the 2020 model, as listed in the Table PF-1. Those projects and projects under construction, or with an application filed to construct, or with an application being prepared were included in the 2024 and 2029 models as appropriate based on projected in service dates (See Table PF-1, Table PF-2 and Table PF-3). Once needs were reconfirmed or identified and solutions were reconfirmed or identified, then solutions were added to the models to confirm limitations are appropriately addressed.
Load forecast
Steady-state summer peak models were built using our customers 50/50 load forecast projections as a starting point, meaning that there is a 50 percent chance that the load level will either fall below or exceed the customer projection. In 2018, customer load forecasts were gathered from ATC customers, at least through the year 2028 (in most cases, through the year 2034). The forecasts were compared to historic data and previous load forecasts to check validity and consistency. Once questions were resolved with the customer, the final forecast information was sent back to the customers as confirmation. Then the data was incorporated into our models.
Some customers did not provide an 11th-year load forecast for the studied year 2029. In these instances the forecast for 2029 was obtained by growing their load by using a 3-year linear growth rate calculated over the last three years of the forecasts provided by the customer. Load power factors and non-scalable loads were held at levels in the last forecast year provided.
In the event ATC or MISO planning processes required a 15th year load projection, a similar methodology was utilized to obtain a projection for 2034 if not provided by the customer. Customer-provided forecasts were extended by growing their load by using a linear annual growth rate calculated over the last three years of the customer’s forecast. Load power factors and non-scalable loads were held at levels in the last forecast year provided.
ATC summer peak total load projections (MW)
| Year | Load (MW) | Study period compounded growth rate |
|---|---|---|
| 2019 | 12,290 | Not applicable |
| 2020 | 12,580 | Not applicable |
| 2024 | 12,744 | 0.73% (2020-2024) |
| 2029 | 12,924 | 0.28% (2024-2029) |
| 2034 | 13,097 | 0.27% (2029-2034) |
| Overall | 0.42% (2019-2034)) |
ATC worked with the distribution companies as much as possible to confirm forecast variations from past historic and past forecast trends.
Model building
Assumptions common to all steady state models
The following subsections contain assumptions that are common to all steady state models studied in the 10-Year Assessment.
- New generation
- Generation retirements
- Cutoff dates for model modifications
- Generation project schedule
- Generation outside of the system
- Generation dispatch
- Line and equipment ratings
- Project criteria
- Normal (Category P0) conditions
- Planned maintenance and construction outages
- Protection systems
- Control devices
New generation
There have been generation projects proposed within the ATC service territory. Many of these proposed projects have interconnection studies completed. Some transmission facilities have proceeded to or through the licensing phase and one or more are under construction. There are also proposed generation projects that have dropped out of the MISO generation queue (refer to Generation Interconnections), adding uncertainty to the transmission planning process. Given this uncertainty we adopted a criterion that only generators with FERC approved interconnection agreements will be included in the planning models.
Generation retirements
Generators connected to the ATC transmission system may be retired or mothballed. Our criteria to determine when generators should no longer be available for dispatch in our 10-Year Assessment models requires a completed MISO Attachment Y study. When this is true the generator will be disconnected in the appropriate load flow study models. In addition, ATC sends an annual letter to each generation owner. Generating companies are asked to identify generator retirements or mothballing that should be included in ATC’s planning horizon. Generators identified as such by the customer will be modeled off-line in the relevant models.
Using the disconnection criteria above, the following generators were assumed out of service in the 2019 10-Year Assessment.
ATC assumed the following generators were to be out of service
| Plant Name | Zone | Installed capacity (MW) |
|---|---|---|
| Edgewater #4 | 4 | 301.5 |
| Fitchburg #1 and #2 | 3 | 31.5 |
| Nine Springs #1 | 3 | 13.5 |
| Pleasant Prairie #1 and #2 | 5 | 1,188 |
| Presque Isle #5-#9 | 2 | 344 |
| Pulliam #7 and #8 | 4 | 210 |
| Sycamore #1 and #2 | 3 | 35.3 |
| Net decrease | 2,123.8 |
Cutoff dates for model modifications
- 2020 models – Dec. 17, 2018
- 2024 models – Dec. 17, 2018
- 2029 models – Dec. 17, 2018
Generation projects schedule
To maintain the schedule needed to complete this Assessment, the models were developed during early 2019. Only those generation projects that qualified to be included in our planning models, as of the various cutoff dates, were included in the Assessment models. For generation projects not planned to be in service by June 2019, the criterion above resulted in the following proposed generation projects being included in the applicable power flow models.
Proposed generation projects being included in applicable power flow models
| Plant Name | Zone | Capacity increase (MW) | Dispatched increase (MW) | Assumed in-service |
|---|---|---|---|---|
| F.D. Kuester (J703) | 2 | 131.7 | 131.7 | Mar 2019 |
| A.J. Mihm (J704) | 2 | 56.5 | 56.5 | Mar 2019 |
| Summit Lake Wind (J711) | 2 | 135.0 | 21.6* | Dec 2020 |
| Point Beach Solar Energy Center (J505) | 4 | 99.0 | 49.5** | Oct 2021 |
| Net increase by Dec 2018 | 0 | |||
| Net increase 2019-2033 | 259.3 |
**solar farm dispatched increase listed is 50% of total installed capacity
A more comprehensive discussion of proposed generation is provided in Generation Interconnections.
Generation 0utside of the ATC system and interchange
The model for the system external to ATC was taken from the most appropriate model included in the 2018 MMWG Series models. The external system interchange was adjusted from the 2018 MMWG Series models to match the latest ATC members’ firm interchange.
Generation dispatch
Balancing Authority area generation was dispatched based on economic dispatch for that Balancing Authority with the exception of the Minimum Load models.
Line and equipment ratings
We revised line and equipment ratings based on updates to our Substation Equipment and Line Database (SELD).
Project criteria
The steady state models built for the 2019 10-Year Assessment include revised system topology based on projects that were placed in service by the model year, or were anticipated to be placed in service by June 15 of that year. Refer to Table PF-1, Table PF-2, and Table PF-3 for projects that were included in the analyses.
Normal (Category P0) conditions
The load flow models for the 10-Year Assessment are built to include established (pre-contingency) operating procedures to assess system performance under the normal (P0) conditions as required in the TPL-001-4 Reliability Standard. The relevant operating procedures are generally standing operating procedures that apply for the planning horizon. These procedures include, but are not limited to, normal open points and switched capacitor banks. Normal open points are assumed to remain normally open in the base cases. Changes in the status of normally open points are provided by the system planners that participate in the decision to change the status of a normally open point. Switched non-mobile capacitor banks are assumed to be available for use by the system operators, except in the case of planned outages. This availability is represented by modeling these capacitor banks in the discrete adjustment voltage regulating mode. Mobile capacitor banks are modeled in the base case when there is a known date and location in the planning horizon during which the mobile capacitor bank is planned to be in service.
Planned maintenance and construction outages
The load flow models for the 10-Year Assessment are built to include specific, long-duration maintenance and construction outages that are expected to occur in the planning horizon. The outages modeled are typically conditions that are expected to last for a period of six months or more, coinciding with the season being modeled. The modeled outages are obtained from ATC’s Transmission Outage Application software.
Protection systems
All appropriate existing and planned protection systems, including any backup or redundant systems that would be applicable to a given contingency were simulated in the studies and analyses. In the steady state simulations, we simulated event-based contingencies that reflect all of the elements that would be removed by the existing or planned protection system. Dynamic studies, in particular, simulate protection system operating times, associated breaker clearing times and backup device tripping functionality.
Control devices
All appropriate existing and planned control devices that would be applicable to a given contingency were enabled in the studies and analyses. These control devices include transformer automatic tap changers, capacitor bank automatic controls, SVCs and back-to-back HVDC (VSC) power flow controllers.
Specific steady state power flow models:
Project deficient models
The load flow models built for the 10-Year Assessment are for system analyses in the Assessment. For some project deficient models, projects were purposely left out of these models in order to verify system problems and determine which problems worsen over time. We have taken the approach of evaluating subsequent summer peak seasons in each of our annual Assessments to determine the immediacy of needs identified, hence providing a means of prioritization.
The 2020, 2024, and 2029 steady state project deficient summer peak models were developed to evaluate needs, verify Assessment findings from previous years, and confirm that previously identified needs will increase over time. The 2029 project deficient models reflect years sufficiently forward in time to determine the need for and assess the performance of larger-scale, long lead-time projects (345 kV lines, for example) that could be needed and expected to be in service in that time frame.
All project models
After the initial analyses portion of the 10-Year Assessment was completed, “All Project” models were built. The “All Project” models were built with all planned and proposed projects included as well as the majority of the provisional projects. The provisional projects included are needed to address system limitations found in the ten year planning horizon that were not addressed by proposed and planned projects. These models are more indicative of the expected system configurations and performance for the three study years than “Project Deficient” models. The “All Project” models are more likely to reflect the projects ATC includes in regional models. As part of the 10-Year Assessment, contingency analyses are performed on each of the “All Project” models. These analyses will verify whether the planned, proposed, and provisional projects included in the models will resolve issues revealed in the 10-Year Assessment process and will not introduce any new limitations.
Load, dispatch and interchange profiles
Models of expected load range
Summer Peak (2020, 2024 and 2029)
- We utilized interconnection point load forecasts provided by various distribution companies in 2018 for both real and reactive power components of load. Please refer to the Load Forecast section for further details.
- The external system interchange for the 2020 peak model was adjusted from the 2018 MMWG Series 2019 peak interchange to match the latest ATC members’ firm interchange. The external system interchange for the 2024 peak model was adjusted from the 2018 MMWG series 2023 summer peak interchange to match the latest ATC members’ firm interchange. The external system interchange for the 2029 peak model was adjusted from the 2018 MMWG series 2028 summer peak interchange to match the latest ATC members’ firm interchange.
- Mackinac VSC set to 5 MW north to south.
- These models are used to support regional model building.
- These models are also used to create models with Generator reactive capability QMax/QMin reduced to 90% for the Assessment.
Shoulder Models (2024 and 2029)
- We started with the summer peak interconnection point load forecasts provided by various distribution companies in 2018.
- To develop shoulder loads, keeping non-scalable loads at LDC-provided shoulder load levels, scalable loads in Zone 2, northern Zone 4, and the remainder of the ATC system were reduced proportionally to attain the following shoulder load levels. The overall Zone 2 load was modeled at 90% of summer peak, northern Zone 4 was modeled at 80% of summer peak, and the remainder of the ATC system load level was modeled at 70% of summer peak. These load levels were chosen for the shoulder models based on historical data to reflect the higher load levels when maintenance may need to occur. However, it is recognized that loads at individual points will vary under real-time shoulder conditions.
- The external system interchange for the 2024 shoulder model was adjusted from the 2018 MMWG Series 2023 shoulder to match latest ATC members’ firm interchange. The external system interchange for the 2029 shoulder model was adjusted from the 2018 MMWG series 2023 summer peak interchange to match latest ATC members’ firm interchange.
- Mackinac VSC set to 5 MW north to south.
- These models are used to support regional model building.
- These models are also used to create models with Generator reactive capability QMax/QMin reduced to 90% for the Assessment.
Models of load sensitivities
Minimum Load Scenario (2020 and 2024)
- ATC Load: 5,242 MW and 5,306 MW, respectively.
- 2018 vintage load forecast collection, scalable loads reduced to 33% of peak and 33% of peak, respectively + non-conforming off-peak loads to equal 40% of Peak load.
- Increased power factor of loads with respect to peak load based on historical data.
- Total ATC Generation: 5,108 MW and 5,186 MW, respectively.
- Includes all planned and proposed projects to be in-service by 6/15/2020 and 6/15/2024, respectively.
- Interchange: Firm interchange only as of 12/17/2018.
- Dispatch: ATC-wide Merit order as of 12/17/2018.
- Mackinac VSC set to 5 MW north to south.
- Special additions: 2024 model includes all planned and proposed ATC projects at the 345 kV level.
- These models are also used to create models with Generator reactive capability QMax/QMin reduced to 90% for the Assessment.
Dynamic stability assessment models
The process for performing dynamic stability assessments includes three types of analyses: (1) the annual review of existing generator angular stability, (2) specific generator interconnection study reports, and (3) specific voltage stability assessments.
The base cases for the annual review of existing generation angular stability for this compliance monitoring period are a 2023 light load model with high local generation, a 2023 light load model with low local generation, a 2023 peak load model with high local generation, and a 2023 peak load model with low local generation. All of the base cases were created using the 2018 series MMWG 2023 models.
The base cases for specific generator interconnect study reports are described in detail in the associated study report.
The base cases for specific voltage stability assessments are described in detail within the associated study report.
Short-Circuit Assessment Models
The base case model for the annual short-circuit assessment was the ATC Near-Term Planning Horizon CAPE (fault study related software) scenario. On an annual basis, the addition of near-term planning horizon transmission modifications are modeled in CAPE and the current-interrupting capability for existing ATC BES circuit breakers and circuit switchers, used to interrupt fault current, are modeled in CAPE. The current-interrupting capability is compared to the expected short circuit fault current using 3-phase and line-to-ground short circuit fault simulations. Mitigation plans are developed where short circuit fault current sufficiently exceeds the device current-interrupting capability. For our studies of new interconnections, the base model is an as-built CAPE scenario. Interconnection studies are used to modify the as-built CAPE base case to include the new interconnected facilities and any proposed transmission system modifications.
Preliminary Needs and Solution Development
Steady State Project-Deficient Needs Assessment
System Intact and No-Load-Loss-Allowed Contingency Simulations
ATC performed system intact and no load loss allowed contingency simulations on the 2020, 2024, and 2029 models. No-load-loss-allowed contingency simulations included all contingencies that do not allow interruption of firm transmission service or non-consequential load loss, as described in the NERC TPL-001-4 standard, as well as P1 and P2-1 contingencies at the 69-kV level. We ran these simulations for all of the steady state models described above.
Comparison of Results vs Planning Criteria
The models described above are analyzed and compared to the ATC Transmission System Planning Criteria. Limits that approach or exceed our criteria are then listed in a limitations table.
Reconciliation of Significant Changes to Power Flow Results
To reconcile changes in power flow results between Assessments, zone planners ran data comparisons to determine if limitations identified in prior Assessments have become more severe, less severe, or have been mitigated. Steps were taken to verify topology and other model changes to ensure that the results are consistent with all of the available information.
Preliminary Solution Development
New Limitation
If a new limitation is found in the initial screening, the zone planner takes steps to ensure that the limitation is valid, including verification of the power flow model. If the new limitation is within the current five-year time frame, the zone planner will then check for potential delayability, including investigation of operating guides or other mitigation measures.
Cost estimates are developed for one or more solution options that effectively address the identified limitations. After cost information has been obtained, the zone planner initiates the project development process by completing the project request to create a provisional project. Finally, the project request is processed through ATC’s project approval process.
Repeat Limitation
If a previously identified limitation is found in our initial screening, the zone planner will re-verify that existing solution options address that limitation. If an in-service date or scope change is warranted, updated cost estimates are developed. The project request is then updated with the revised in-service date, cost, scope and/or justification. The updated project request is then resubmitted through ATC’s project approval process.
If a previously identified limitation was not found in our screening, the zone planner will confirm the need did not appear in this assessment or any other parallel studies. If the need does not appear in three annual assessments the potential solution will then be removed from the project list.
Unspecified-Network Capital Forecast Process
Unspecified-Network capital dollars (strategic) are defined as those potential solutions that are likely to shift into the 10-year time frame, but the exact need, solution, and schedule cannot be determined at this time. Unspecified-Network dollars may be needed for the following reasons.
- Changing load forecasts.
- Changes in generation and distribution interconnection projects.
- Changes in public policy requirements.
- Additional projects that are driven by economic benefits or multiple outage impacts.
Dollars are set aside in ATC’s capital forecast to address Unspecified-Network need drivers. ATC begins to identify Unspecified-Network dollars with internal discussions to determine how to best serve our customers local and regional needs. In these discussions, we determine which potential solutions are more likely to be built within the 10-year Assessment period should events happen that cannot currently be accurately predicted. The cost and potential benefits of the solutions are discussed, vetted, and approved by our executives. After internal consensus is reached, the ATC capital forecast is updated to include dollars for these Unspecified-Network need drivers. Project requests are not initiated for these Unspecified-Network dollars until specific needs are confirmed.
All Projects Assessment
After the 10-Year Assessment project deficient analysis is completed, models are built that include all planned, proposed, as well as the majority of the provisional projects. The provisional projects included are needed to address system limitations found in the ten year planning horizon that were not addressed by proposed and planned projects. These models are called “All Projects” models and are more indicative of the expected system configurations for the 2020, 2024, and 2029 study years.
As part of the 10-Year Assessment, contingency analysis is performed on each of the “All Projects” models. The contingency analysis includes all no-load-loss-allowed contingencies, as described in the Steady State Project-Deficient Needs Assessment section. The analysis will verify whether the planned, proposed, and provisional projects included in the models will resolve issues revealed in the Assessment process.
This “All Projects” analysis assesses the list of reinforcements that are beginning to define our reinforcement plan. The following are three important questions regarding this plan.
- How do all the reinforcements perform together?
- Does applying a solution create a problem that was not seen before?
- Are some solutions redundant when all the solutions are applied to the system?
We address the first two questions in our 10-Year Assessment. “All Project” models built for years 2020, 2024, and 2029 include projects identified in the project tables for this Assessment observing specific in-service dates. In the spirit of the NERC TPL Standards, Table I, “no-load-loss-allowed” contingency analysis was performed on these models, including selected contingencies in neighboring systems. This analysis showed that no additional reinforcements were needed. The third question is addressed during our detailed project development process.
Other Studies
Multiple Outage Review and Analysis
ATC performed a steady-state assessment for the applicable multiple-element contingency categories of planning events and extreme events identified in the NERC TPL-001-4 Reliability Standard. These evaluations may be performed on an annual schedule, a rolling periodic schedule, or for specific interconnection studies.
Category P “Load-Loss-Allowed” contingencies
Generally, ATC performs an annual comprehensive analysis of Category P “load-loss-allowed” contingencies that are inside of the ATC system. The ‘load-loss-allowed’ contingencies refer to all the planning events in NERC TPL-001-4, Table 1, that allow interruption of Firm Transmission Service and Non-Consequential Load Loss.
For base case models, to perform the assessment of Category P ‘load-loss-allowed’ contingencies that are outside of the ATC system, ATC generally uses the annual reliability planning assessments of MISO (the Planning Coordinator for the ATC system). MISO’s assessment includes all of the systems adjacent to the ATC system. This allows ATC to identify potential performance deficiencies inside of the ATC system due to these external contingencies and develop potential mitigation to address deficiencies.
For sensitivity case models, to perform the assessment of Category P ‘load-loss-allowed’ contingencies that are both inside and outside of the ATC system, ATC also uses the annual reliability Planning Assessments of MISO. This allows ATC to identify potential performance deficiencies inside of the ATC system due to these internal and external contingencies and develop potential mitigation to address deficiencies.
Category E contingencies
Generally, for a comprehensive assessment of Category E contingencies, ATC uses the annual reliability Planning Assessments of MISO to identify the consequences and adverse impacts to the ATC system.
System stability review and analysis
ATC generally investigates three types of system stability: steady state voltage stability, dynamic voltage stability, and dynamic angular (e.g. generator) stability.
The specific system performance criteria that are used to assess the transmission system for each type of system stability are given in the ATC Transmission System Planning Criteria.
Steady state voltage stability
The steady state voltage stability analysis (e.g. P-V Curve simulation) is performed on a specific area of the ATC system when steady state analysis indicates areas of very low voltage or potential voltage collapse (non-convergent simulations) for NERC TPL-001-4 reliability standard contingencies in the near- or long-term planning horizons. Additionally, each dynamic study performed by ATC screens for voltage stability issues through the application of the ATC voltage recovery criteria described in the ATC Transmission System Planning Criteria. If general steady state or dynamic analyses identifies areas of weakness indicative of voltage instability, further examination of system characteristics and, possibly, more detailed analysis will be performed.
Dynamic voltage stability
The dynamic voltage stability analysis is performed on a specific area of the ATC system when steady state analysis indicates areas of very low voltage or potential voltage collapse (non-convergent simulations) for NERC TPL-001-4 reliability standard contingencies in the near- or long-term planning horizons. Dynamic voltage stability analysis can reveal results where the voltage at some buses will collapse and not recover to the acceptable values found in steady state analysis. Steady state analysis assumes that the system “rides through” the dynamic recovery period.
Dynamic voltage stability analysis is assessed for any new or revised generation interconnection facilities before they are placed in service.
When dynamic analysis is performed, very large loads may be modeled with specific dynamic models and the remaining loads are modeled using lumped dynamic load models that depend on the percentage of industrial, commercial, and residential load at each distribution load interconnection point.
Dynamic angular (generator stability)
The dynamic angular stability of all major generation facilities in the ATC system is assessed on a five-year rotation. Generation facilities may be assessed in less than five years if there are significant changes including data for: the generator exciter, the generator governor, a power system stabilizer, the generator step up transformer, or nearby system topology. In addition, dynamic angular stability is assessed for any new generation facility before it is placed in service.
Generation facilities with a total net output above 100 MW and associated transmission lines operating above 100 kV are normally selected for system angular stability assessment. The methodology used in assessing the need for stability analysis at major generator stations includes:
- A review to determine that no significant system topological changes have occurred near the generator stations other than local load growth.
- A review to determine that no significant changes have occurred for the parameter values and the model types used in representing the dynamic response of units at the generator stations in system angular stability simulations.
- A review to determine that the elapsed time does not exceed 5 years from the date of the last stability study conducted for each of the major generator stations.
When analysis is needed, the assessments consider applicable simulation requirements and performance requirements in the NERC TPL-001-4 reliability standards, as well as the ATC dynamic performance criteria.
ATC observes a ½ cycle margin for tested generator data and a 1 cycle margin for planned generator data. These margins are observed between the Maximum Expected Clearing Time (MECT) and Critical Clearing Times (CCT) that can lead to unacceptable system instability.
Documentation
Writing/approval processes
The 10-Year Assessment is written and developed by several contributors. The following steps are performed in order to ensure cohesive, consistent, non-CEII information is posted publicly.
- Requests are made for the latest financial, environmental, demographics, asset renewal, and economics information from other ATC departments.
- Drafts of text, figures, and tables are compiled for peer review.
- A summary presentation of Assessment information is reviewed and approved by ATC management.
- CEII information is documented in a separate electronic document with restricted distribution.
Once the information has been approved internally, the Summary Report is distributed publicly. The Summary Report and additional non-CEII details are posted at www.atc10yearplan.com.